Data storytelling is a defined approach for communicating data insights in impactful ways and is gradually adopted as an effective medium to disseminate science and raise awareness.
It involves three key elements: a) Data that represents the facts; b) Visuals that bring data into life as data visualisations, infographics, dashboards, and unique data presentations; and (c) Narrative that involves all the essential parts of a story, i.e., plot, characters, conflict and resolution.
Storytelling through data is highly flexible to incorporate modern marketing and advertisement delivery practices. A typical example is the ad sequences. The advertisement/story is not exposed in one iteration but in sequences that gradually reveal the entire story to the audience via pre-defined stages. In addition, engaging data stories can also become a successful medium for behaviour change and lifestyle shift to meet long-term climate targets.
In that sense, the LIBRA AI team had developed the "Another one bites the beef!" data story in collaboration with the Specter Design Group to make people realize the environmental impact our food habits have and motivate a potential change in our lifestyle. The LIBRA AI Data Science team was responsible for the data exploration and primary concept of this data visualisation project. Our design companion, the Specter Design Group, did an excellent job on the design, the copywriting and the refinement of the concept.
We have based our story on the scientific results provided in the following publications:
- Poore, Joseph, and Thomas Nemecek. "Reducing food’s environmental impacts through producers and consumers." Science 360.6392 (2018): 987-992.
- Stylianou, Katerina S., Victor L. Fulgoni, and Olivier Jolliet. "Small targeted dietary changes can yield substantial gains for human health and the environment." Nature Food 2.8 (2021): 616-627.
According to those outcomes, our food habits can impact the environment. But facts alone are not sufficient to persuade since numbers rarely speak for themselves. On the other hand, people often feel overwhelmed and even detached by masses of data.
An engaging and easier-to-digest infographic, like the one we designed for our story, can attract people's attention to the message and help them understand how a simple change in our food habits can minimize the effects of the food industry on climate change.
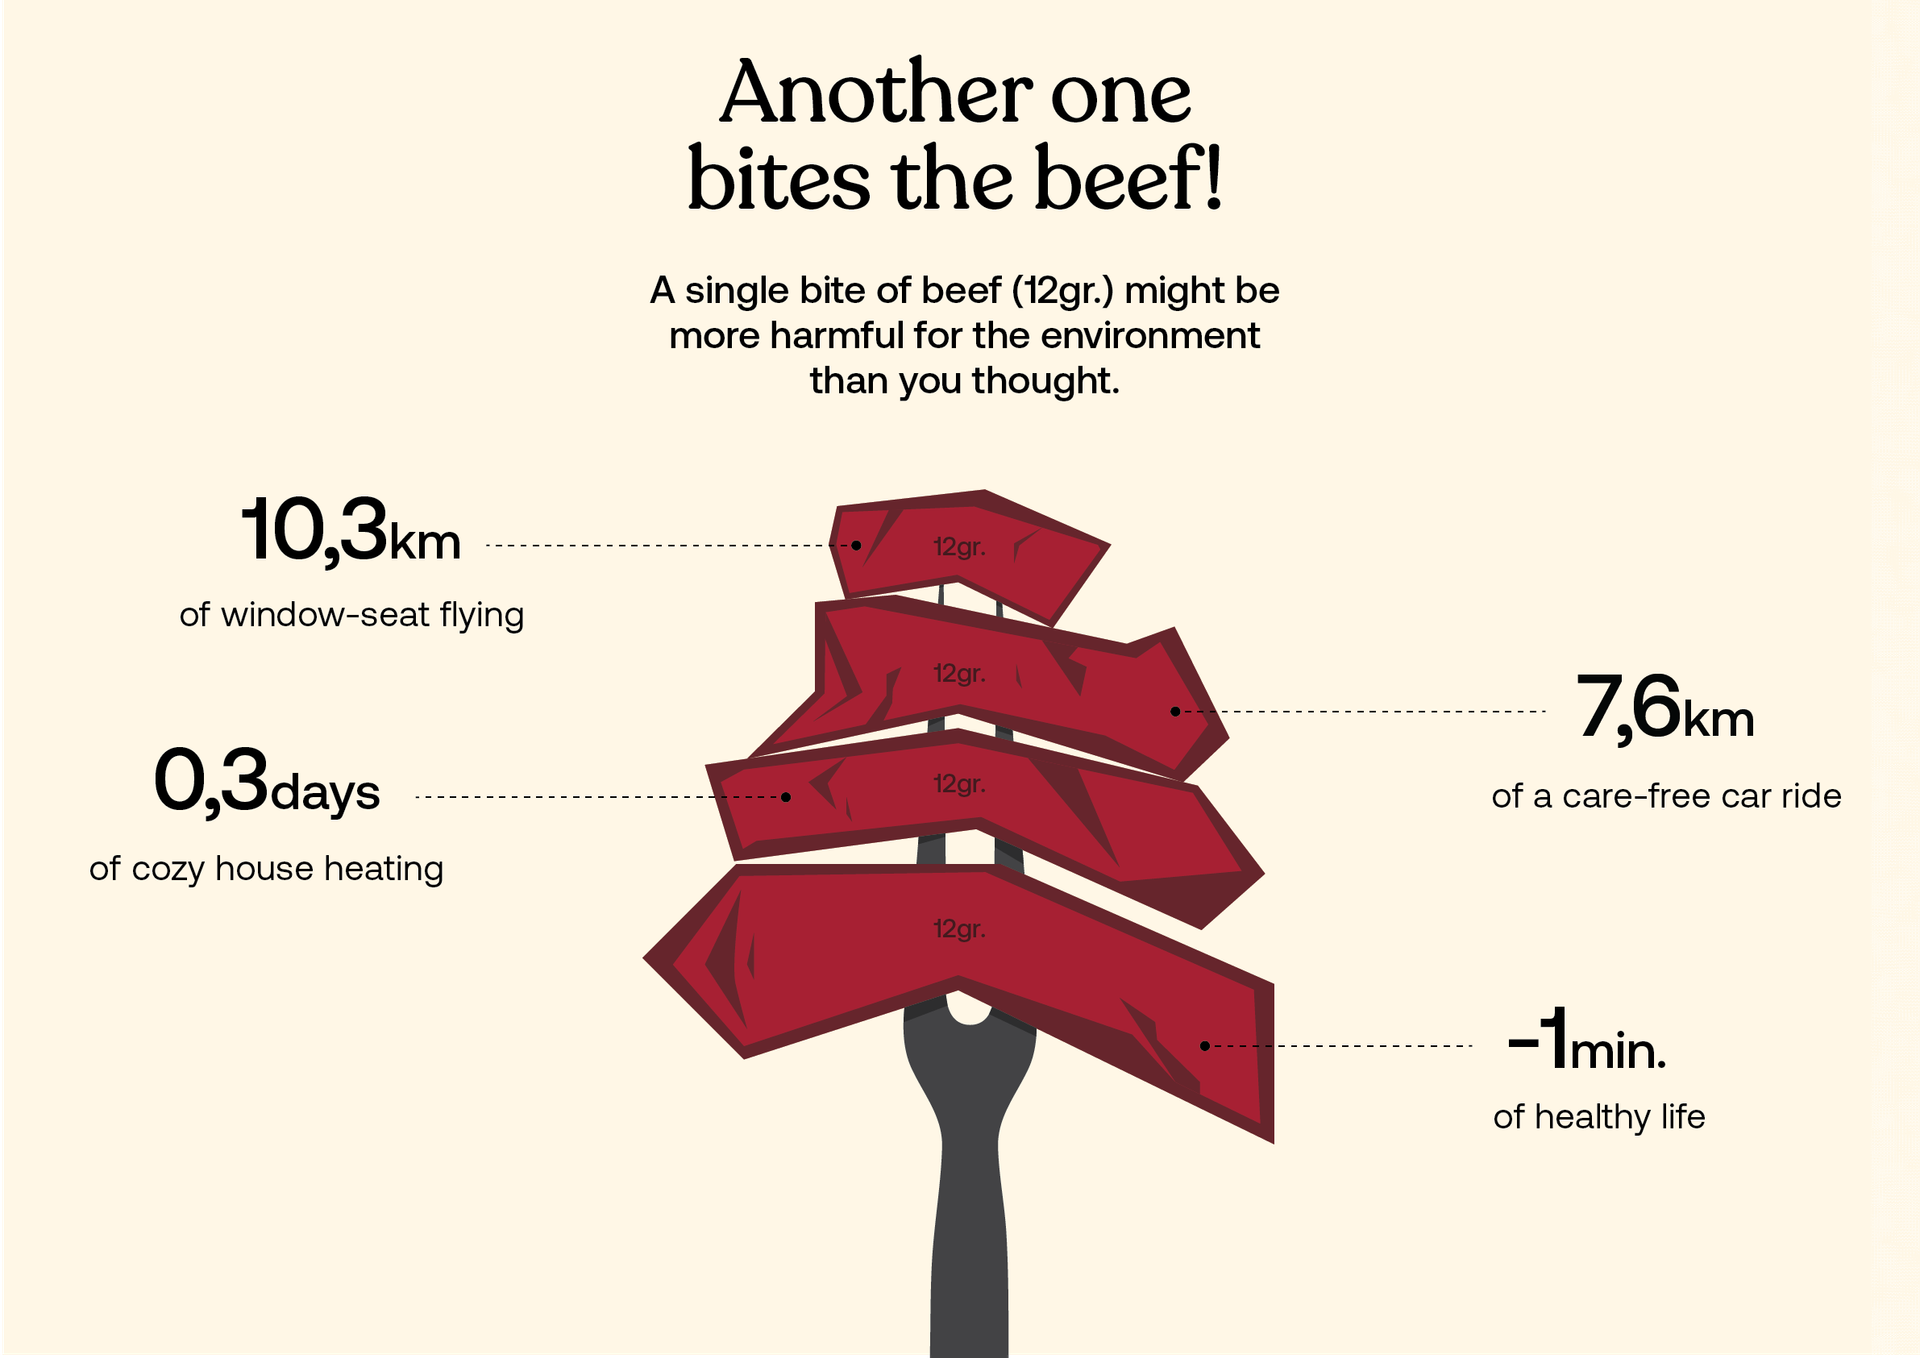
The story was completed with the narration. We chose to present the link between a single bite of beef with selected GHG equivalents related to our everyday activities to be more understandable and triggering to a wider audience.
Accompanying the design, the research facts and the concept in such a way, the story becomes more direct and relevant to everyone:
“If you avoid eating 12gr of bacon, you can have an impact in the reduction of CO2 emissions equal to:
- 10,3 km of window-seat flight.
- 0,3 days of cosy-house heating.
- 7,6 Km of a care-free car ride.
Or even gain one precious minute of a healthy life!”
Have we succeeded in making you re-think your dinner tonight?