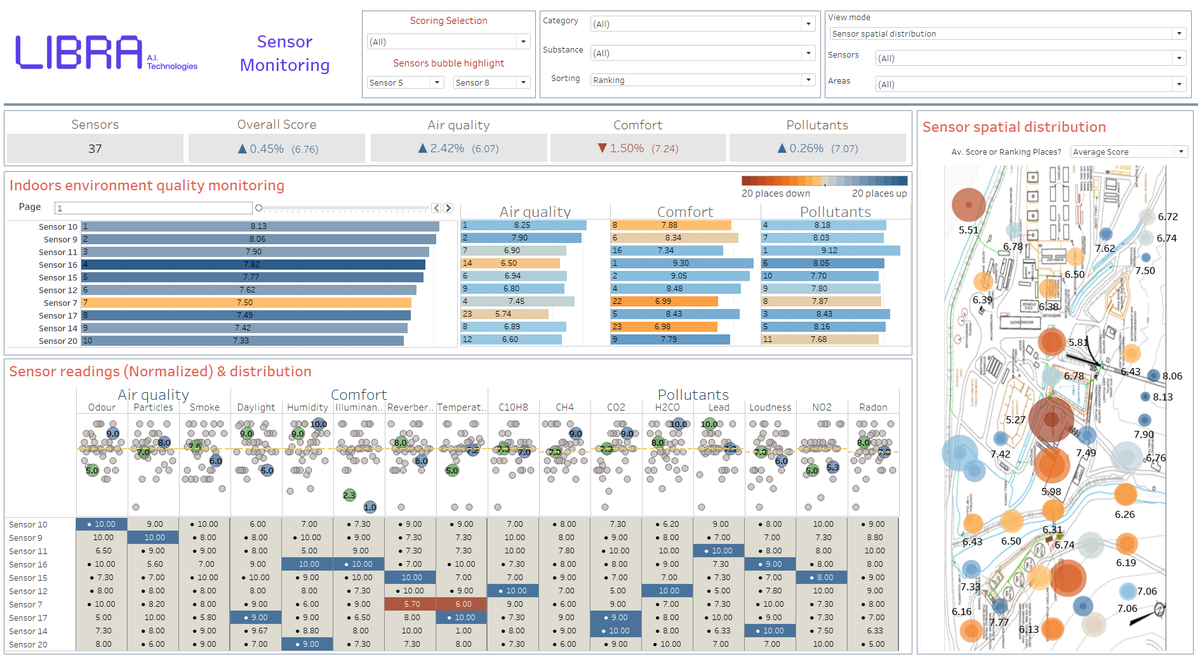
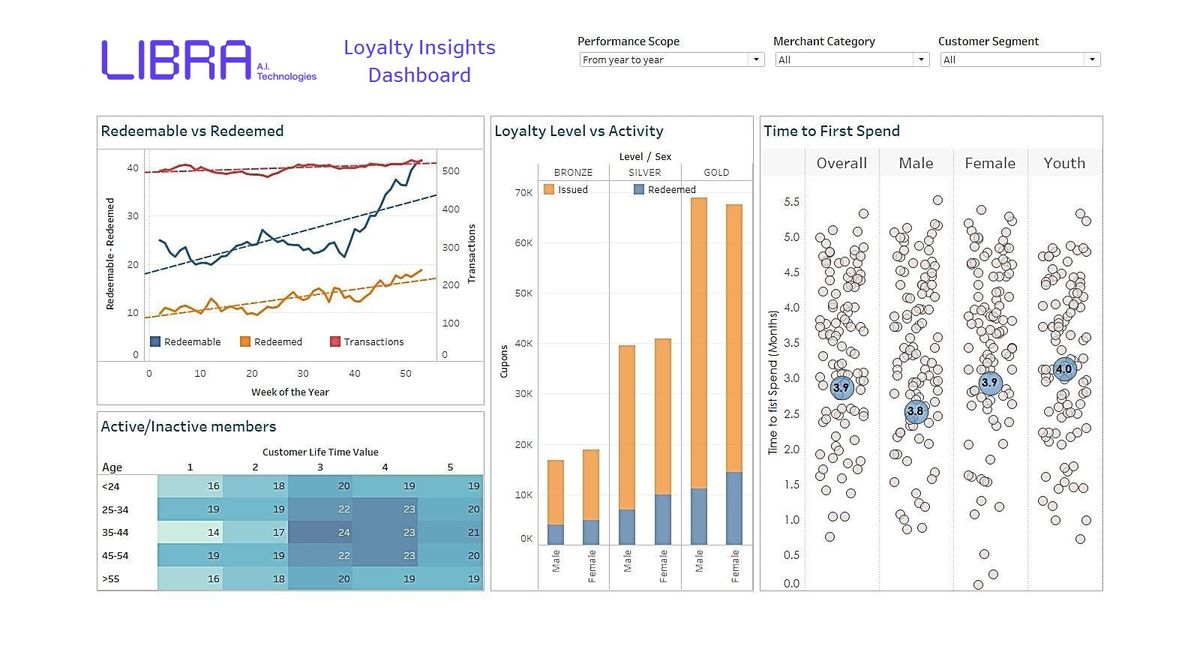
Visual data exploration
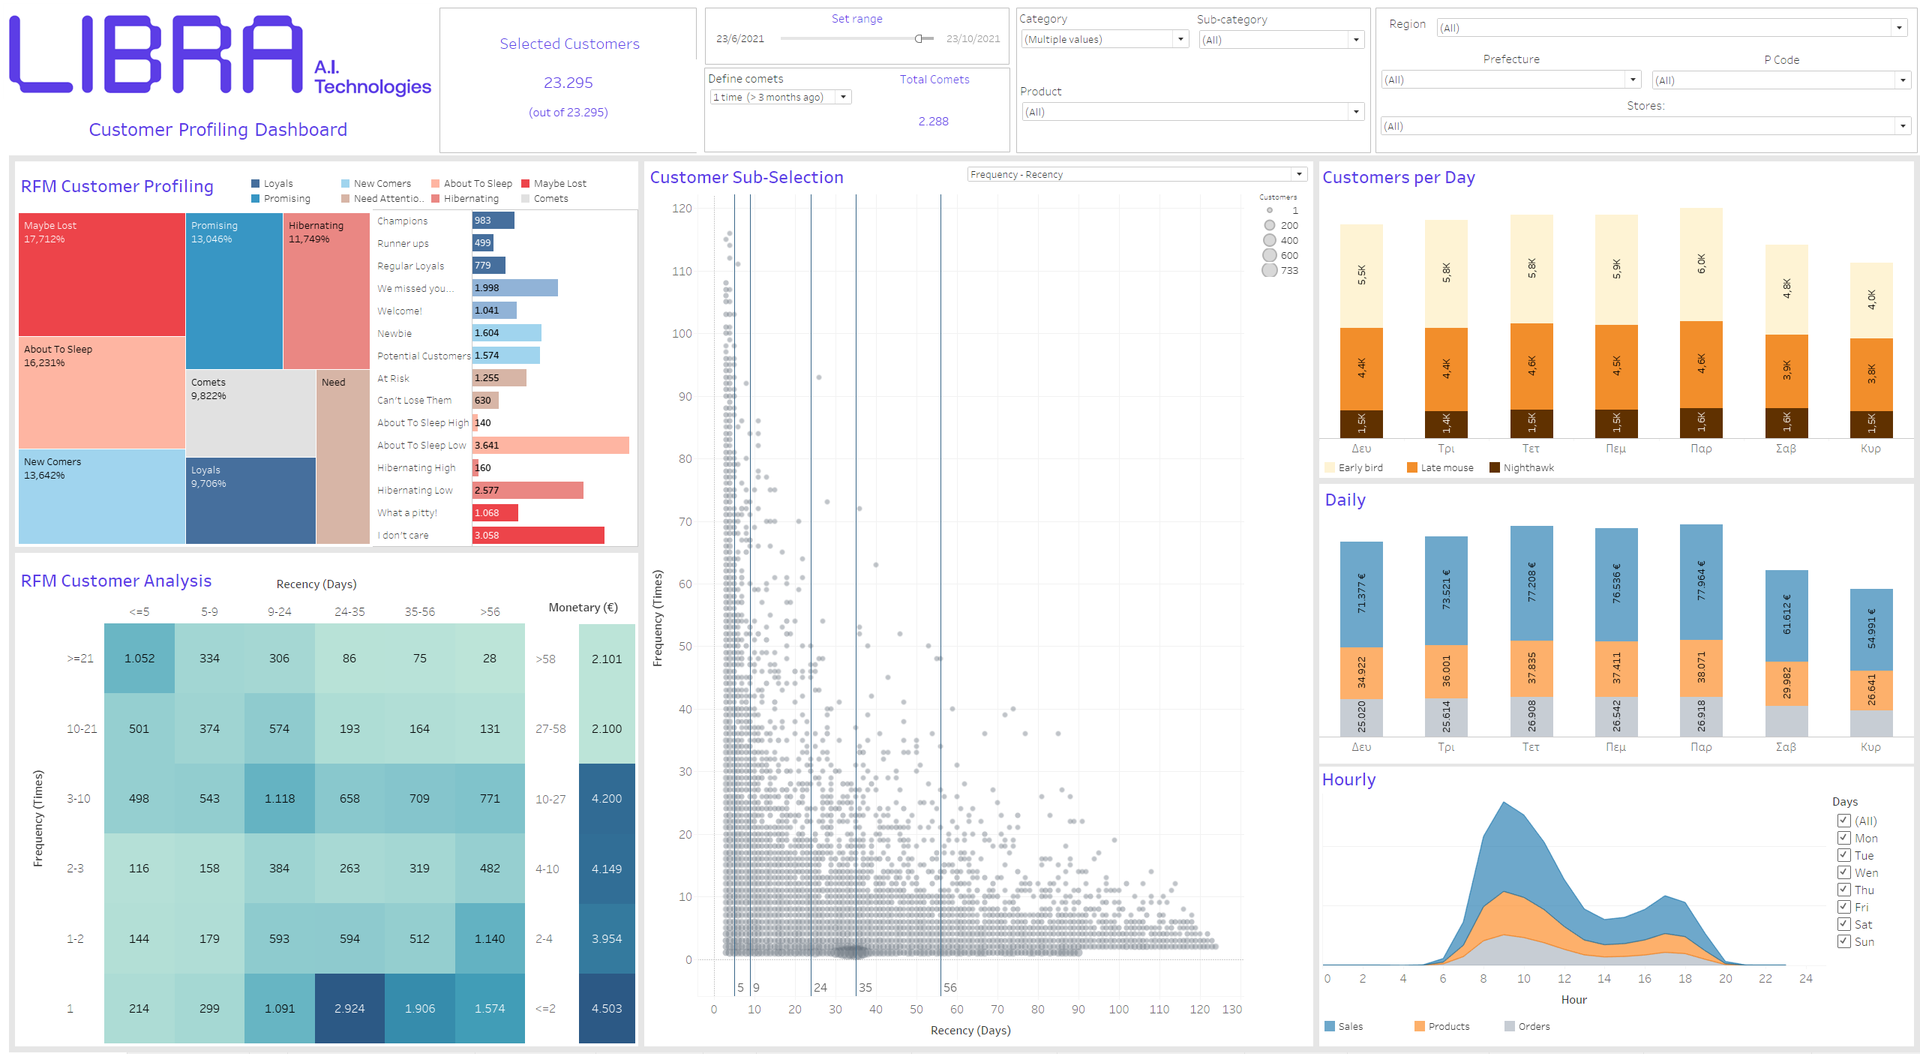
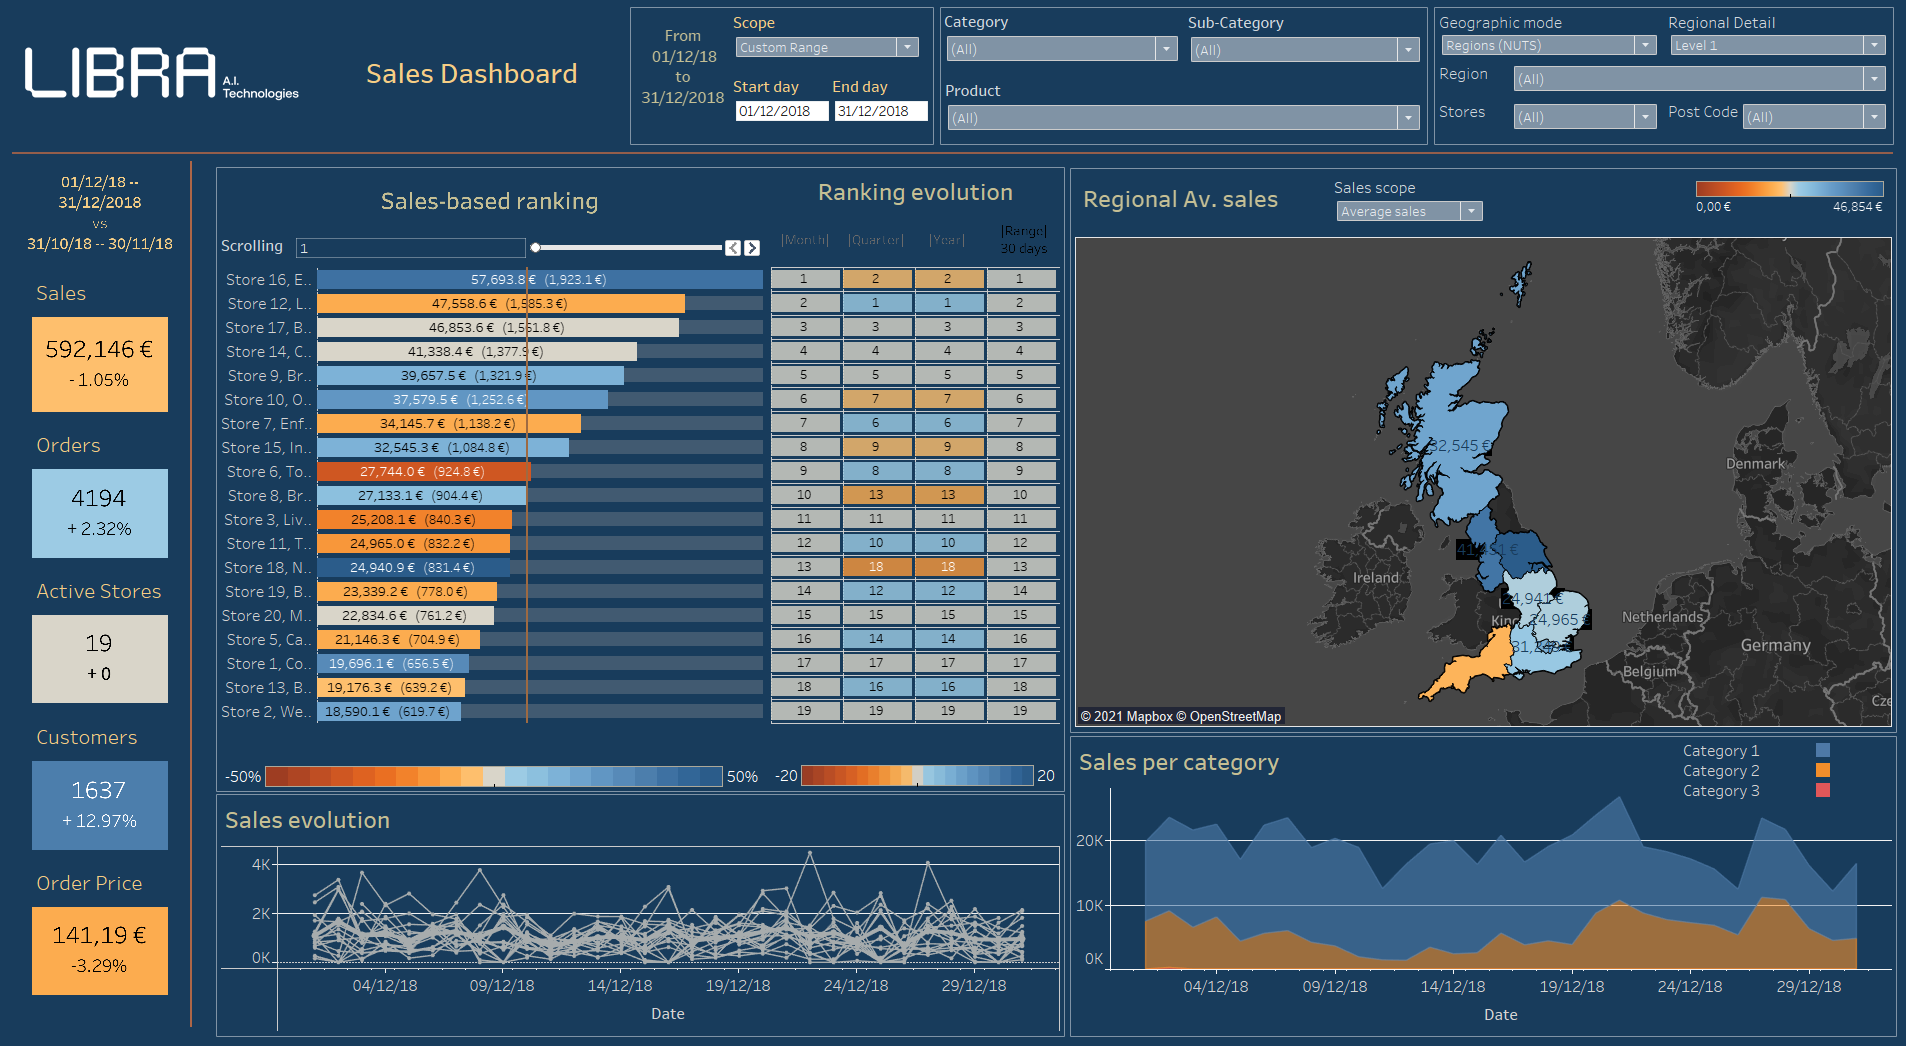
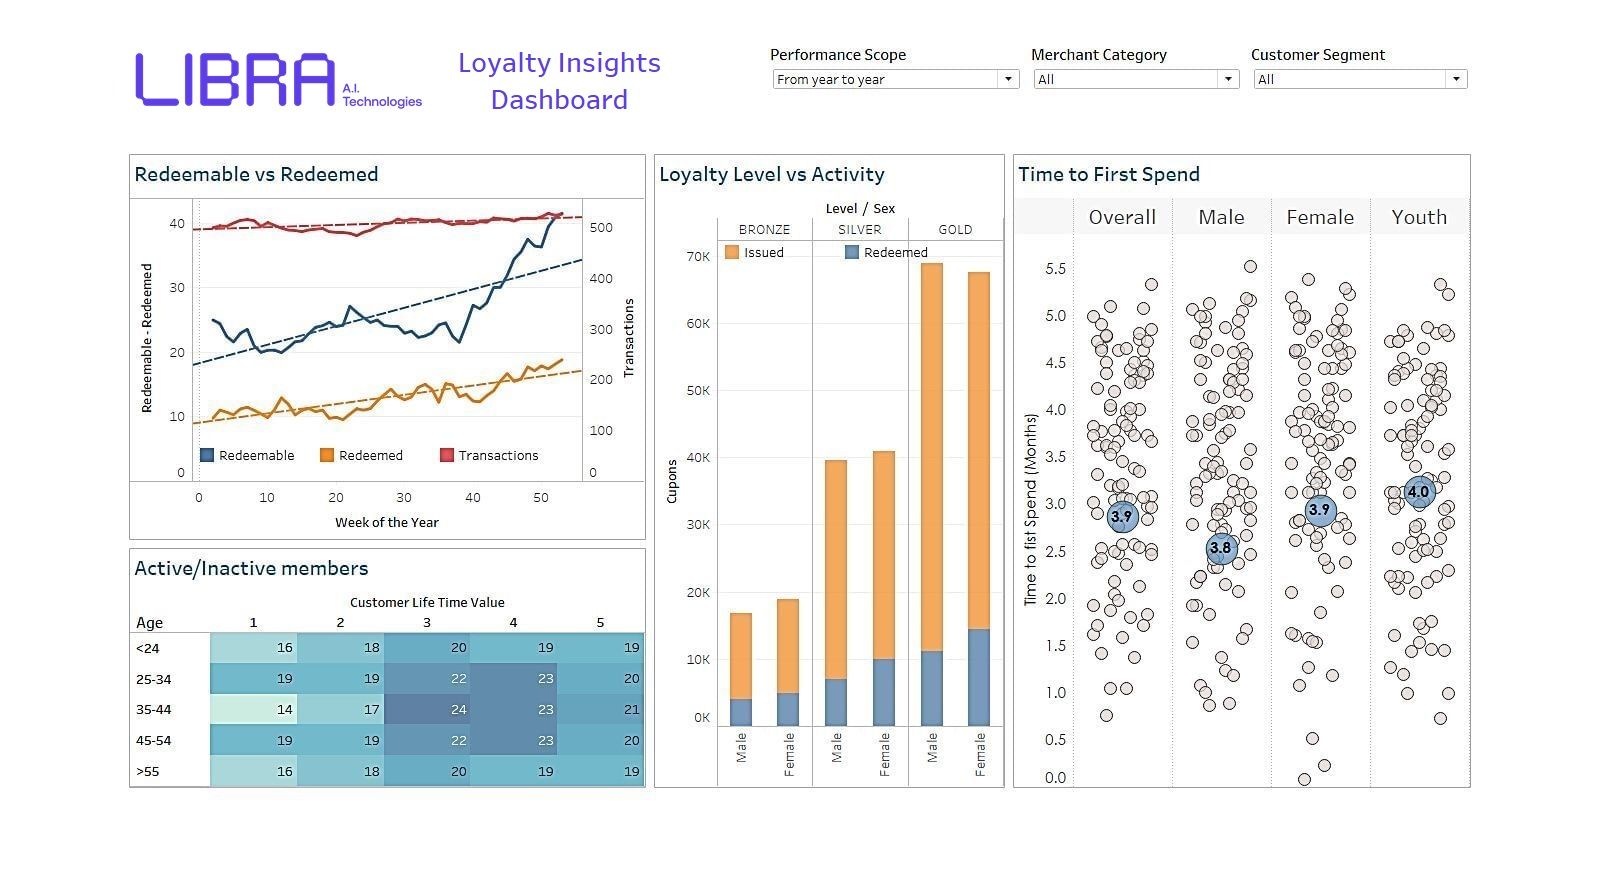
Our dashboards are laser focused on your business and display critical information in meaningful, insightful ways. They will allow you to:
- get a 360 view of your business operations,
- grasp your customers and their needs, and test your marketing actions,
- identify areas for improvement and make decisions with confidence.


 Drag to select
Hotel prices vs tourists arrivals for Athens, Bangkok & Cape Town
* Average overnight accommodation prices for a standard double room.
Anyone in your organization will be able to perform exploratory visual analytics and unlock new insights and value. To succeed in this, our dashboard design and development is not an one-off process.
We focus on data aspects that convey critical information for your business case, providing you with distilled rather than raw information.
We seriously consider the background, competences and needs of the end-users of each dashboard separately.
We are working in close collaboration with you following a co-development process.
Dashboards remain in evaluation status for a long period after delivery. This gives you plenty of time to play around and do actual data exploration. Your feedback will then be fully reflected in a fresh update.
We eagerly follow the best visual design practices. We optimize our dashboards with eye tracking technologies to balance the salience of items and make sure that elements which are most important stands out above the rest. We are serious in drawing your focus on actionable data!


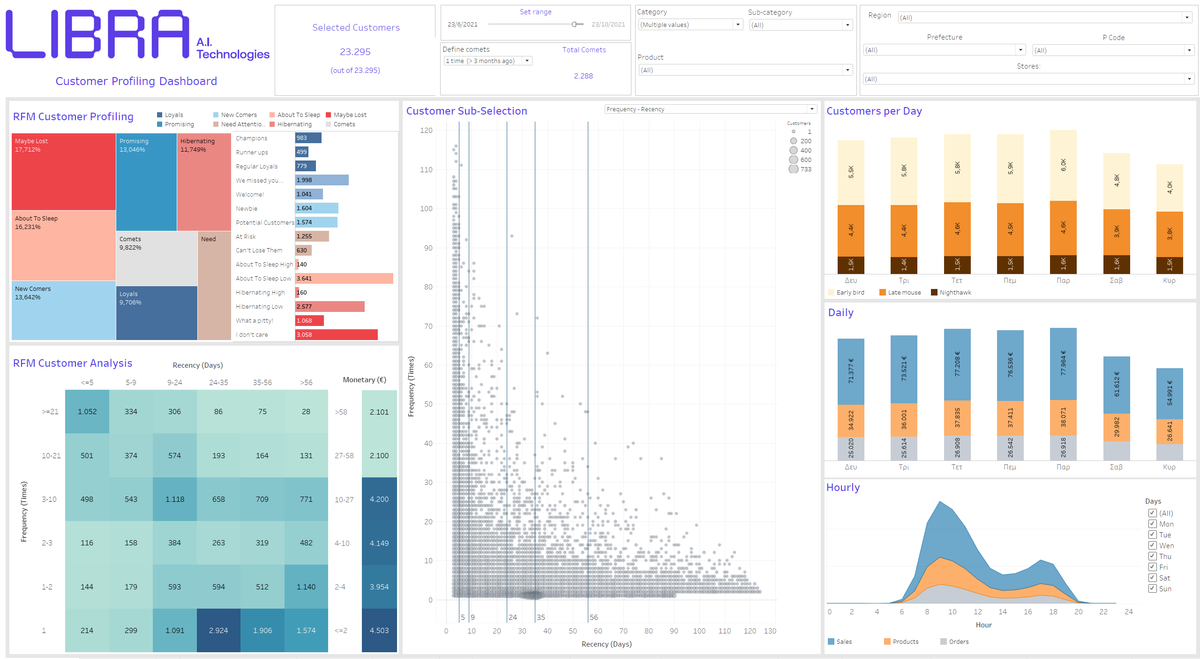
We deliver our interactive dashboards in Full HD (1080p) format. This gives you plenty of space to concurrently investigate several aspects, correlations and views of the data leading to deeper insights.
You can get business insights at your fingertips with our Mobile format dashboards, anytime and on any device.
We embed Artificial Intelligence components for advanced business analytics within your dashboard-suite. Now your dashboards do not only display “what happened” but also what will happen and why!

All of our dashboards are accompanied with user-friendly text and/or video guides. You will also get handy cheat sheets for quick reference. Of course, we are always available for distance or in-site training and consultancy.