
The quality of business intelligence is determined long before a dashboard is opened. It begins with the ability to interpret raw data correctly, and for many industrial organisations, turning fragmented sensor signals into structured, usable information remains a slow and highly manual process.
This challenge was at the centre of LIBRA AI Technologies’ contribution to the 6th International Conference on Electrical, Computer and Energy Technologies (ICECET 2026), held in Rome, Italy, on 6–9 July 2026. On Thursday 9 July, our team virtually presented the peer-reviewed paper “Bridging Raw Sensor Data and BI Systems: An AI-Driven Metadata-Aware Mapping Approach” introducing a practical smart method for connecting raw sensor data with Business Intelligence systems.
The proposed approach combines the behaviour of each sensor signal with the meaning of its metadata, helping identify the correct sensor type and measurement unit automatically. By reducing repetitive integration of work while keeping experts involved in uncertain cases, the solution is designed to make industrial data pipelines faster, scalable, and more reliable.
The Challenge: Why Sensor Data Integration Doesn't Scale
Picture the file that lands on a data engineer’s desk: column after column of raw sensor readings with names like Flow_Is, ElecCondMeasure and Altura. Which sensor produced for each one? In which unit? Industrial BI depends on sensor networks that are heterogeneous in every way that matters with different sampling rates, inconsistent measurement units, and column names that are abbreviated, non-standard, or written in different languages. Before any dashboard can deliver a single insight, every signal must be mapped to the correct sensor type and measurement unit. Traditionally, mapping is done by hand or with hard-coded rules. Neither approach scales.
Our Solution: Reading Both the Signal and Its Context
Our answer is to teach the model to read a signal the way an experienced engineer does by looking at how it behaves and at what it is called. The framework fuses two complementary sources of evidence:
- Temporal patterns: two time-series encoders — ROCKET and Chronos-T5 — capture both the local structure and the long-range dynamics of each signal.
- Semantic cues: a multilingual language model (MiniLM) embeds column names, so abbreviations and non-English labels become useful evidence rather than noise.
A gradient-boosting classifier combines both streams and predicts the sensor type and measurement unit across more than 40 classes, attaching a confidence score to every prediction. High-confidence results are accepted automatically; ambiguous ones reach a human expert as a top-five shortlist through a web-based validation tool that writes verified mappings directly into the BI database, a fully human-in-the-loop workflow. The machine does heavy lifting; the expert keeps the final say.
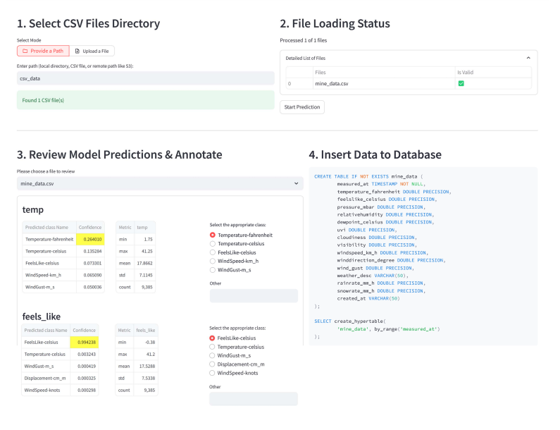
The AI-assisted sensor data mapping tool: experts upload sensor files, review the model’s predictions, validate mappings, and insert verified results into the BI database.
Measurable Results Across 40+ Sensor Classes
We evaluated the framework on eight public data sources plus real industrial data. Each signal had to be matched to the correct combination of sensor type and measurement unit, out of more than 40 possibilities. In plain terms:
- The first guess is right 86.5% of the time. The model’s top prediction identified the correct sensor type and unit in 86.5% of cases (F1 score: 0.865, on a scale where 1 is perfect).
- The right answer is in the shortlist over 97% of the time. For uncertain cases, the model hands the user-expert its five best candidates, and in more than 97% of cases, in every configuration tested, the correct answer is among them. Validation becomes a quick pick rather than detective work.
- It works even without column names. Labels are often missing industrial data; the framework then classifies from the signal’s behaviour alone, with no change to the pipeline.
- It reads other languages. A column named Altura (Spanish for “height”) was correctly mapped to Height in metres with 91% confidence — the language model recognised what the signal alone could not reveal.
From the Lab to the Mine: Validation in a Real Deployment
The real test came from the field. Within the EU-funded MASTERMINE project, the framework faced sensor data from a large-scale mining operation, data segments the model had never seen during training. The distinctive signals were easy to detect; flow-rate measurements were auto-accepted with 99.98% confidence. The genuinely ambiguous ones were routed to an expert for quick validation, exactly as designed. The result: manual integration effort drops dramatically, while final labelling decisions stay under human control.
From Validation to Real-World Value
The work presented at ICECET 2026 shows how an approach developed and tested in an R&D environment can move into real operational use. By combining temporal signal analysis with multilingual metadata, the framework reduces manual data-mapping effort while keeping experts in control of uncertain cases. Its deployment within MASTERMINE demonstrates that the method can integrate with existing BI workflows and support reliable decision-making beyond the laboratory. Because the approach is industry-agnostic, it can be adapted to organisations across sectors that need to turn complex sensor data into structured, usable business intelligence.
For more information, read the full paper
See the full presentation here: Bridging Raw Sensor Data and BI Systems | IEEE ICECET 2026